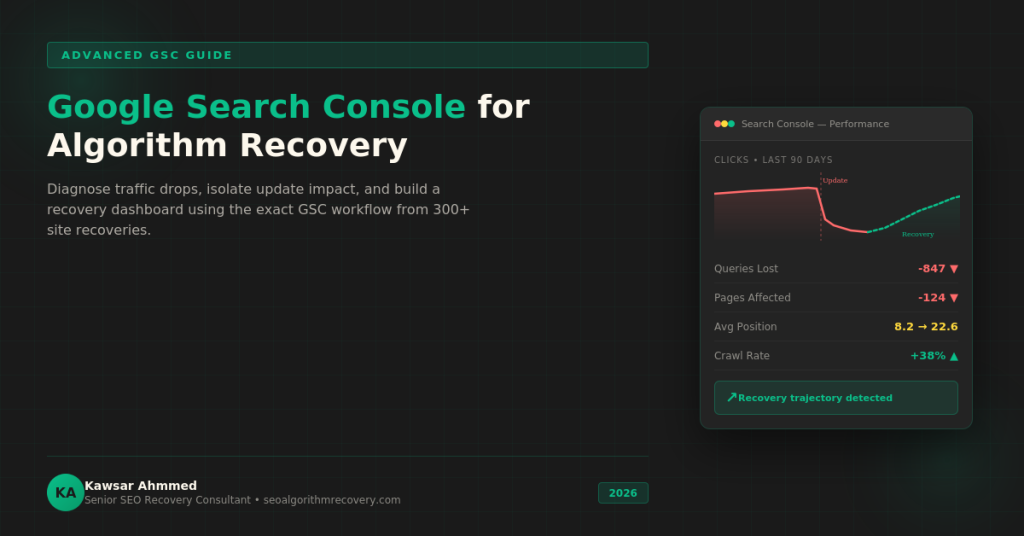
Google Search Console is the single most important free tool for diagnosing why your site lost traffic after an algorithm update. By comparing performance data across update timelines, analyzing query and page level losses, and monitoring crawl behavior after fixes, you can pinpoint whether a core update, helpful content update, or spam update caused your drop and build a targeted recovery plan.
Every recovery project I take on starts inside Google Search Console. After working through 300+ algorithm penalty recoveries, I can tell you that site owners consistently misread GSC data or skip the comparison views that actually reveal what happened. They look at the wrong date range, ignore page-level losses, or never check crawl stats after making fixes.
This guide walks through the exact GSC analysis process I use with every client. If your business website got hit by an algorithm update or you are seeing unexplained ranking drops, this is where you start.
Setting Up GSC Comparison Views to Isolate Algorithm Update Impact
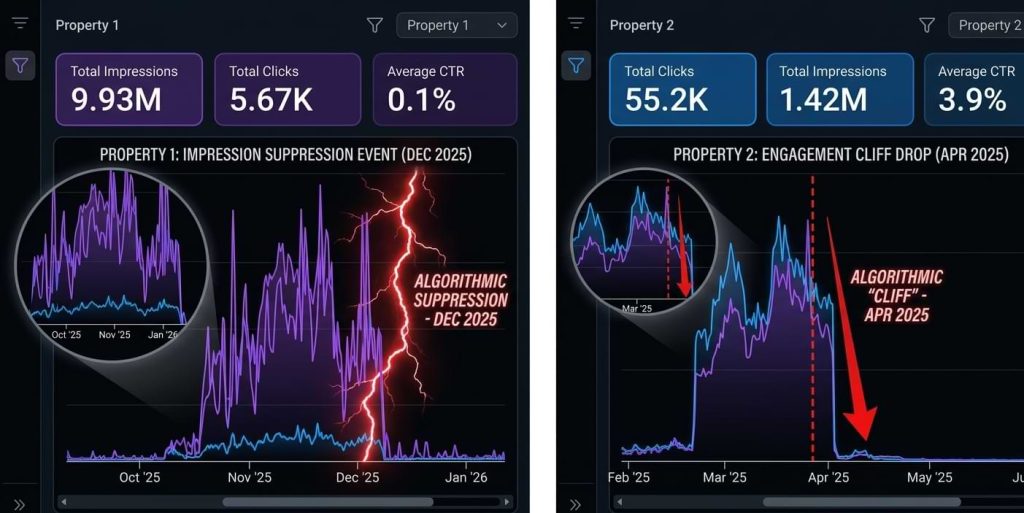
The first mistake most site owners make is checking their overall traffic graph and panicking. That top-level view hides what actually changed. Instead, you need to set up date range comparisons that align precisely with known algorithm update rollout dates.
Open the Performance report in GSC and set your date range to the 28 days after the update started rolling out. Then compare it to the 28 days immediately before. This isolates the update impact from seasonal trends and normal traffic fluctuation. Google maintains a Search Status Dashboard that lists confirmed update dates, so always cross-reference your timeline against the official rollout window.
I recommend creating three separate comparison views for every recovery diagnosis:
- 28-day pre-update vs. 28-day post-update: Reveals immediate ranking and click impact with enough data volume to filter out daily noise
- 90-day pre-update vs. 90-day post-update: Catches slow-bleed losses that take weeks to fully materialize, common with helpful content demotions
- Year-over-year same period: Separates seasonal declines from algorithmic penalties, especially important for e-commerce and travel sites
Performance Report Deep Dive: Queries Lost, Pages Lost, and Position Changes
Once your comparison view is set, switch from the aggregate view to the Queries tab. Sort by click difference (descending) to see which search terms lost the most traffic. In my experience across recovery cases, three patterns usually emerge that point to different update types.
| Signal | Core Update Hit | Helpful Content Hit | Spam Update Hit |
| Query Loss Pattern | Broad losses across many topics | Informational queries drop while brand terms hold | Exact-match and thin keyword pages disappear |
| Page Loss Pattern | Top pages lose 20-60% positions | Blog/content hub pages hit hardest | Doorway pages and auto-generated content deindexed |
| Position Change | Gradual decline, positions 3-8 drop to 15-40 | Slow bleed over 4-8 weeks post-update | Sudden drop from page 1 to page 5+ |
| Click Impact | 30-50% traffic loss typical | 40-70% on affected content sections | 80-95% on penalized pages |
| Measurement | Compare top 50 queries by clicks, track position changes weekly | Filter by page type (blog vs. service), monitor impressions per query cluster | Check indexed page count in Coverage report, review manual actions panel |
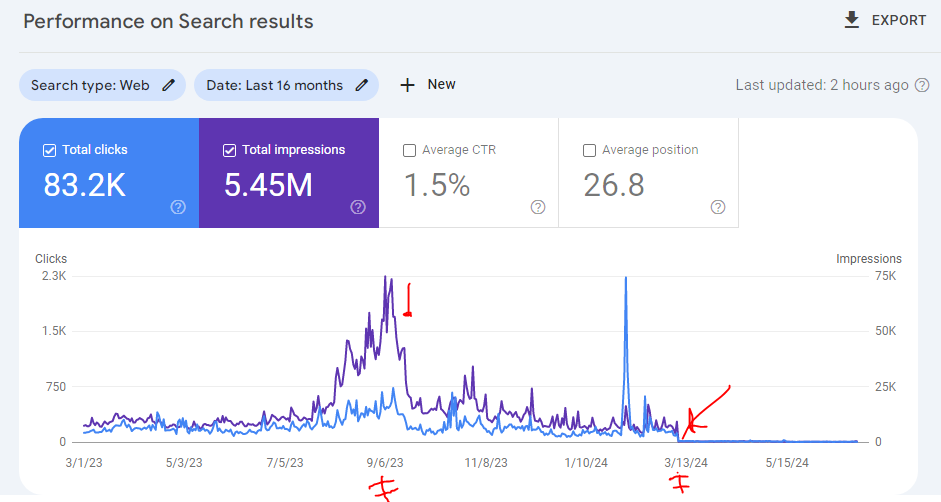
After identifying the pattern, switch to the Pages tab and repeat the same comparison sort. The pages that lost the most clicks tell you where Google lost confidence in your site. For affiliate sites that got hit, I cover the full recovery playbook in my guide on affiliate site recovery after algorithm updates.
Coverage Report for Recovery: Deindexed Pages, Crawl Anomalies, and Quality Exclusions
The Coverage report (now called the Pages report in the updated GSC interface) is where most site owners stop looking too early. After an algorithm update, check three specific areas in this report.
Excluded pages with the reason “Crawled, currently not indexed.”A sudden spike in this category after an update means Google crawled your content and decided it was not worth indexing. This is a strong signal of a quality-based demotion, which often correlates with helpful content or thin content penalties.
Pages flagged as “Duplicate without user-selected canonical.”When Google starts choosing different canonical URLs than you intended, it signals a trust issue with your content. I have seen this pattern in roughly 40% of sites hit by core updates, where content overlap between pages confused Google about which page deserved to rank.
Understanding your content pruning options is critical at this stage. Sites with large volumes of low-quality indexed pages often benefit from strategic removal, a process I break down in my content pruning strategy for SEO recovery guide. According to Google’s crawling and indexing documentation, the crawl budget allocated to a site is influenced by both server health and the perceived quality of already-indexed content.
Using URL Inspection and Crawl Stats to Verify Your Fixes
Making recovery changes without verifying that Google has actually recrawled and reprocessed your updated pages is the most common reason recovery timelines stall. Here is the verification workflow I follow for every recovery client.
After updating content on a priority page, open the URL Inspection tool and request indexing. Then check the rendered page to confirm Google sees your changes. Pay attention to the “Page fetch” status and the “Crawled date.” If the crawled date does not update within 3 to 5 days after requesting indexing, your page may have a crawl priority issue.
Next, open the Crawl Stats report under Settings. Look for two things:
- Total crawl requests per day: A declining crawl rate after an algorithm update suggests Google is deprioritizing your site. Healthy recovery shows crawl rates stabilizing or increasing as fixes roll out
- Response time trends: If your average response time exceeds 500ms, Google may throttle crawling. SaaS platforms with heavy JavaScript rendering often hit this wall, something I address in my guide on SaaS SEO recovery after algorithm traffic drops
Building a GSC Recovery Dashboard: The Exact Metrics I Monitor Weekly
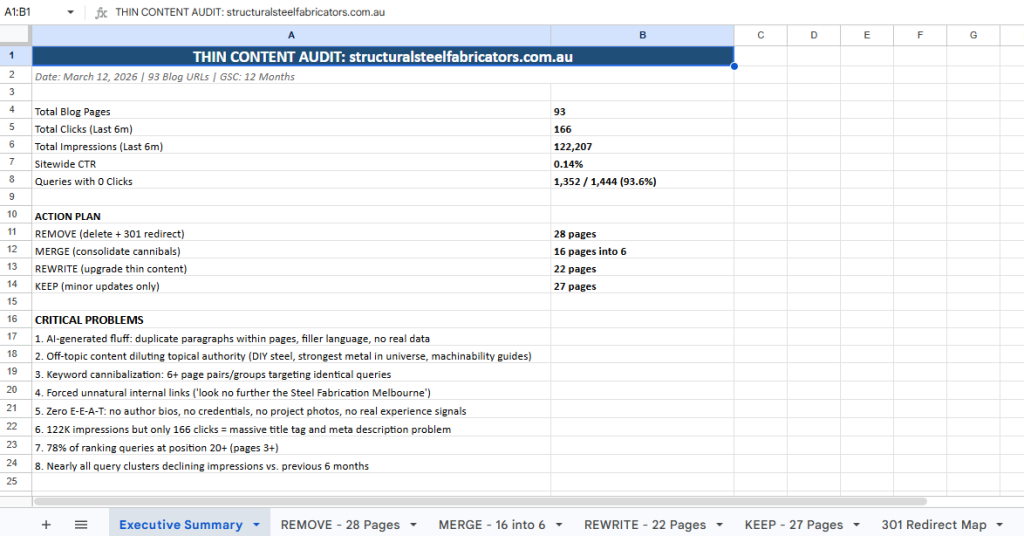
Recovery is not a one-time fix. It requires weekly monitoring to confirm that changes are producing results and to catch any secondary drops. Here is the dashboard framework I set up for every recovery client inside GSC.
Weekly check 1: Top 20 recovery queries. Filter your Performance report to the 20 queries that lost the most clicks. Track their average position week over week. You want to see a steady climb of 2 to 5 positions per week for the first 4 to 6 weeks after fixes go live.
Weekly check 2: Indexed page count. Go to the Pages report and note the total valid (indexed) pages. After pruning or consolidating content, this number should decrease intentionally. If it drops without you removing pages, Google is deindexing content on its own, which signals a continuing quality issue.
Weekly check 3: Core Web Vitals pass rate. The Experience report in GSC shows your pass rate for Core Web Vitals on mobile and desktop. While CWV alone rarely causes algorithm penalty-level drops, fixing CWV issues alongside content improvements sends a compound quality signal. Sites that hit 90%+ CWV pass rate during recovery consistently see faster position restoration in my client data.
Local businesses dealing with algorithm drops face unique GSC challenges around map pack visibility and local query tracking. I cover those specific scenarios in my local SEO recovery after algorithm updates guide.
When GSC Data Points to a Problem Bigger Than a DIY Fix?
If your GSC analysis shows losses across more than 60% of your indexed pages, position drops averaging 20+ spots, and crawl rate declining simultaneously, you are likely dealing with a site-wide quality reassessment. These multi-signal penalties are the hardest to recover from alone because they require coordinated content, technical, and authority fixes executed in a specific sequence.
That is exactly what I specialize in. If you want a professional reading of your Search Console data, you can learn more about my approach and track record on my SEO algorithm recovery expert page.
Frequently Asked Questions
How long does it take to see recovery signals in Google Search Console?
Most recovery signals start appearing in GSC data within 2 to 4 weeks after implementing fixes, but full recovery timelines range from 30 to 120 days depending on update type and site size. Core update recoveries typically take longer than spam update recoveries because they require the next core update rollout to fully reassess your site.
Can I diagnose a Google penalty using only Search Console?
GSC is the best starting point for penalty diagnosis, and it is the only tool that shows manual actions directly. For algorithmic penalties, GSC data combined with knowledge of update timelines gives you roughly 80% of the diagnostic picture. The remaining 20% typically requires backlink analysis tools like Ahrefs or Semrush to identify toxic link profiles and content quality assessment tools.
What is the most important GSC report to check after an algorithm update?
Start with the Performance report using date range comparison. This immediately tells you the scale of impact, which queries dropped, and which pages were affected. From there, the Pages (Coverage) report reveals whether Google is deindexing your content, and Crawl Stats show whether Google is even bothering to re-evaluate your site.